9 Inspiring Gantt Chart Examples for Effective Project Management
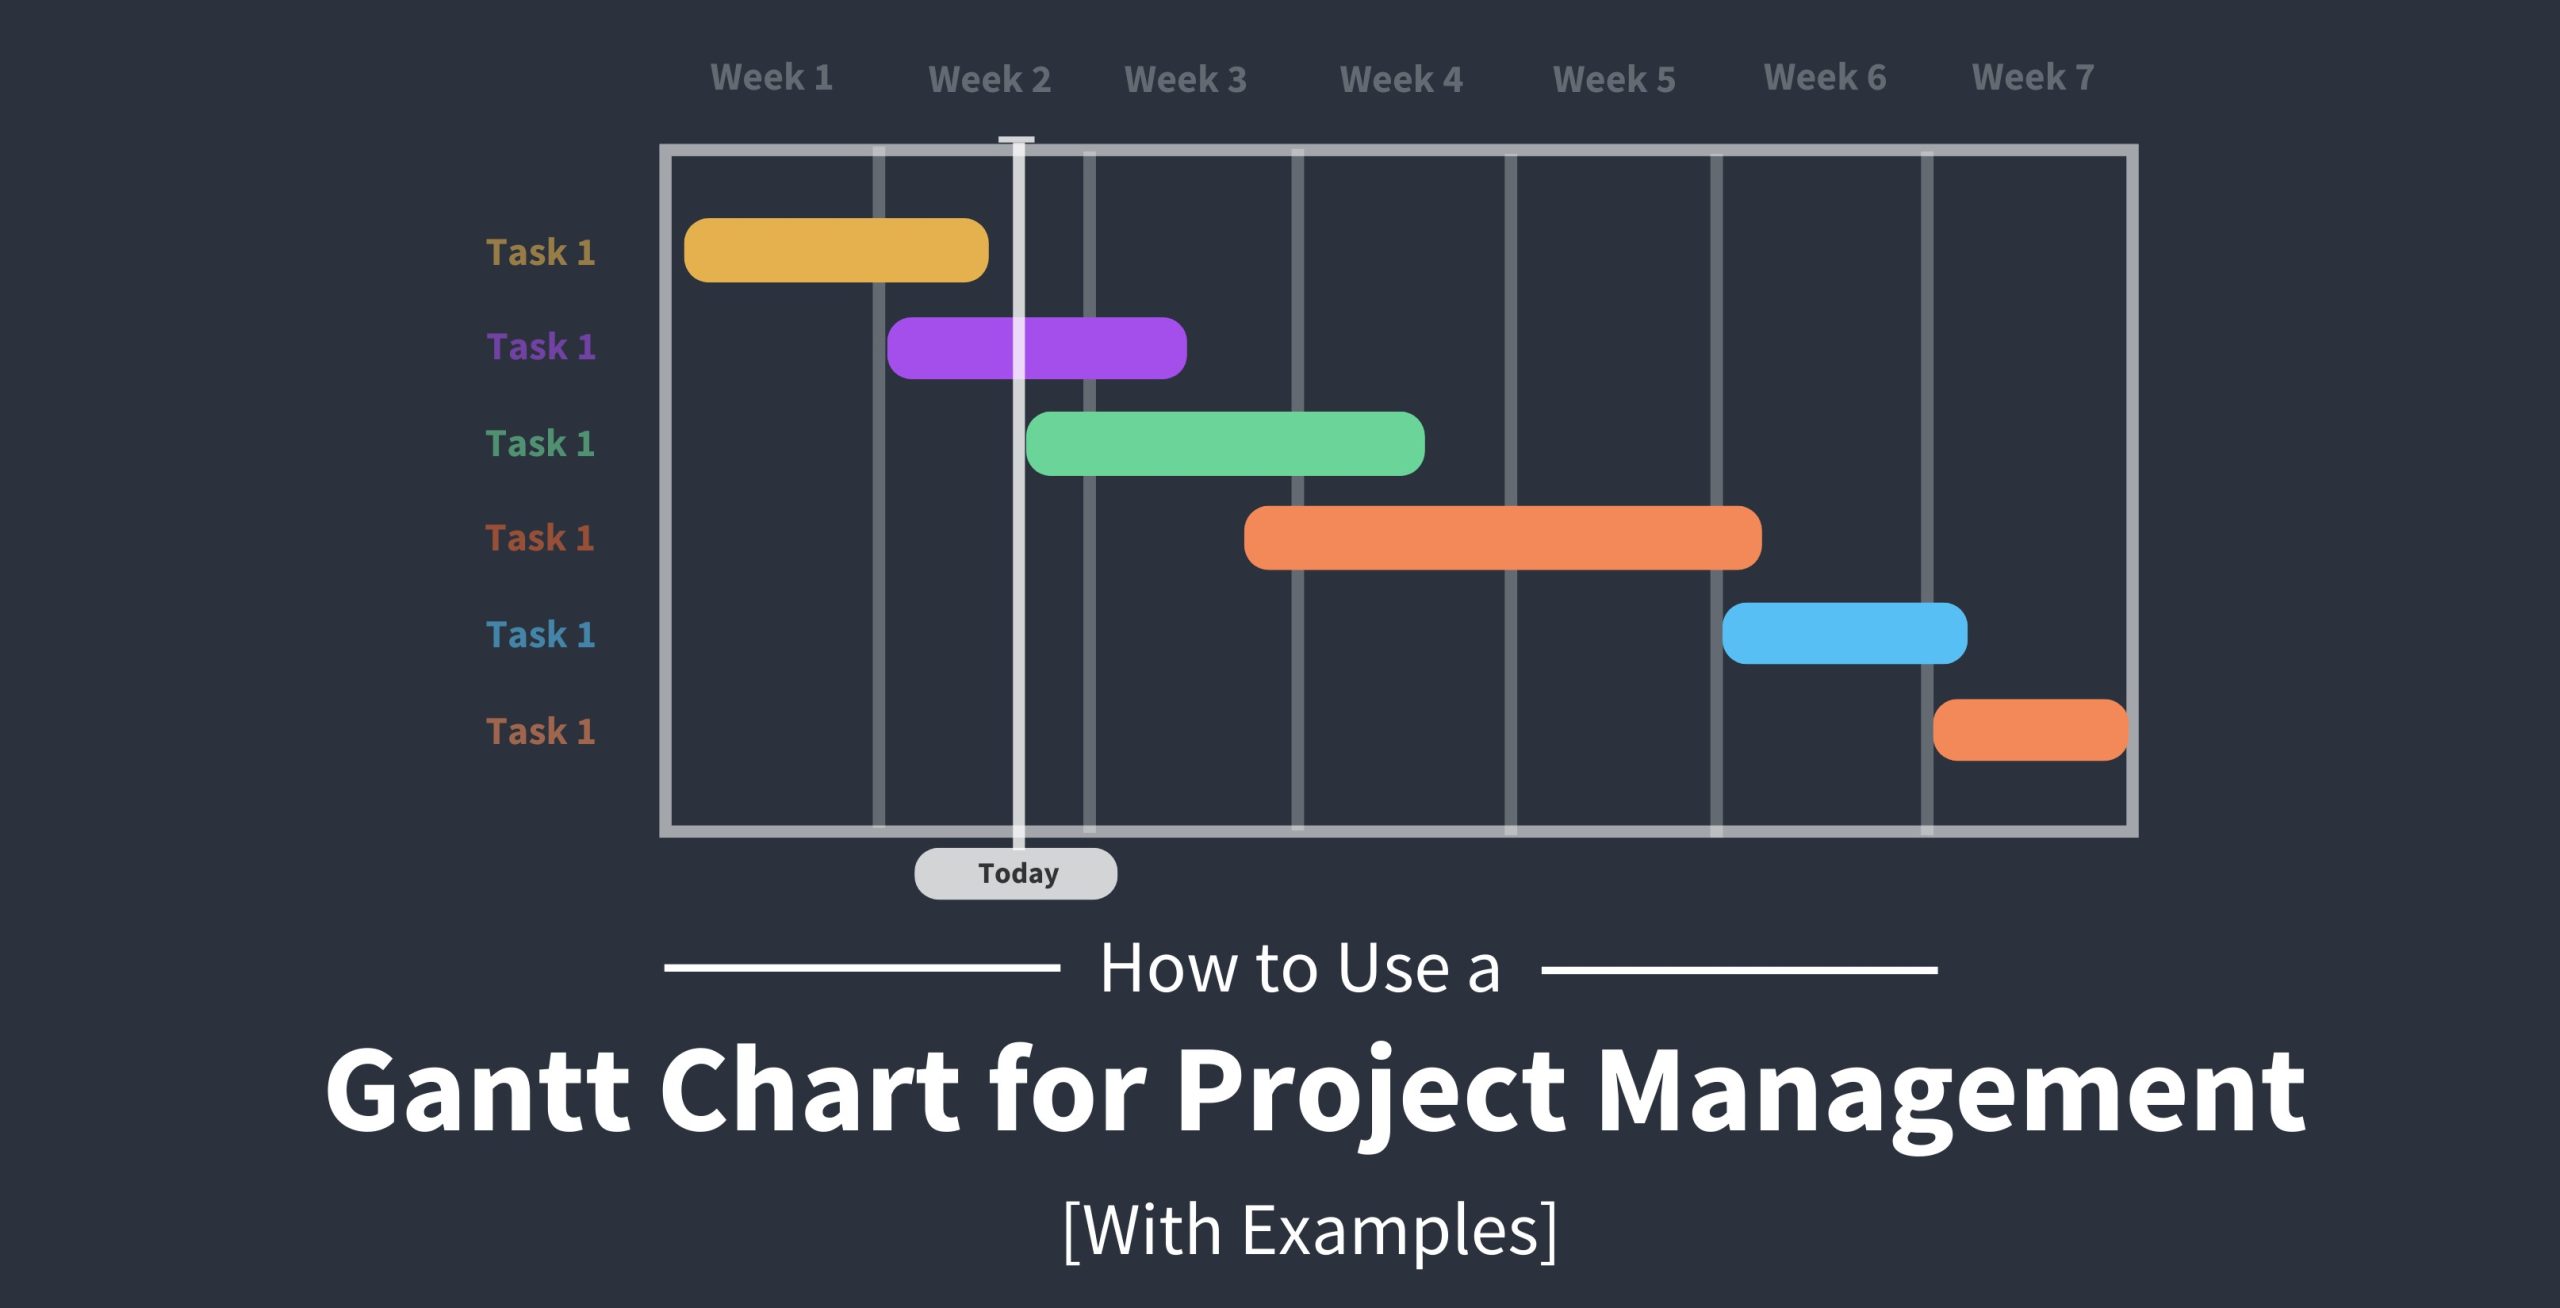
In project management, visual tools play a crucial role in planning, scheduling, and tracking project progress. One such powerful tool is the Gantt chart. A Gantt chart provides a visual representation of project tasks, timelines, dependencies, and resource allocation. In this blog post, we will explore nine Gantt chart examples that demonstrate its versatility and effectiveness in project management. We will also delve into the reasons why Gantt charts are widely used in project management.
Construction Project
A Gantt chart for a construction project showcases the various phases, such as site preparation, foundation, structural work, electrical work, and finishing touches. It helps project managers allocate resources, identify critical path activities, and monitor project milestones, ensuring the project is completed on time.
Software Development
In software development, a Gantt chart illustrates the development stages, including requirements gathering, design, coding, testing, and deployment. It helps teams identify dependencies between tasks, allocate development resources, and track progress across different development cycles, ensuring timely software delivery.
Event Planning
For event planning, a Gantt chart helps visualize the tasks involved in organizing an event, such as venue selection, marketing, ticketing, logistics, and post-event activities. It allows event planners to allocate resources, manage deadlines, and coordinate various activities, resulting in a successful event.
Marketing Campaign
A Gantt chart for a marketing campaign outlines the activities, timelines, and milestones associated with different marketing channels, such as social media, email marketing, content creation, and advertising. It helps marketers plan campaigns, allocate resources effectively, and coordinate activities for maximum impact.
Product Launch
For a product launch, a Gantt chart highlights the tasks required at each stage, such as product development, quality testing, packaging design, marketing strategies, and distribution. It assists product managers in managing resources, tracking deadlines, and ensuring a smooth and successful product launch.
Research Project
In a research project, a Gantt chart displays the research activities, data collection, analysis, and report writing phases. It helps researchers schedule tasks, allocate resources, and track progress, ensuring timely completion of the research project.
Website Development
A Gantt chart for website development showcases the different stages involved, including content creation, design, development, testing, and launch. It allows web development teams to manage tasks, dependencies, and resource allocation, ensuring an efficient website development process.
Manufacturing Process
In manufacturing, a Gantt chart illustrates the production stages, procurement, inventory management, quality control, and shipping. It helps manufacturing managers allocate resources, track production timelines, and identify potential bottlenecks, leading to an optimized manufacturing process.
Training Program
For a training program, a Gantt chart outlines the training modules, scheduling of sessions, resource allocation, and assessment periods. It assists trainers in planning and organizing training activities, managing timelines, and ensuring a structured and effective training program.
Why Gantt Charts are Used in Project Management
Visual Representation
Gantt charts provide a clear and visual representation of project tasks, timelines, and dependencies, making it easier for project teams to understand the project’s overall structure and progress.
Task Dependencies
Gantt charts help identify task dependencies, allowing project managers to schedule and prioritize activities accordingly. This ensures that tasks are completed in the correct order and that subsequent tasks can begin without delays.
Resource Allocation
Gantt charts enable project managers to allocate resources effectively. By visualizing resource availability and task timelines, managers can assign resources efficiently and avoid overloading or underutilizing team members.
Timeline Management
Gantt charts help manage project timelines by highlighting critical path activities and potential bottlenecks. Project managers can identify tasks that are falling behind schedule and take appropriate actions to mitigate delays.
Communication and Coordination
Gantt charts serve as a communication tool, providing a shared understanding of project timelines and milestones. Team members can easily see their tasks, dependencies, and deadlines, fostering collaboration and coordination.
Progress Tracking
Gantt charts allow for real-time progress tracking, enabling project managers to monitor task completion, identify any delays, and take corrective actions. This helps keep the project on track and ensures timely delivery.
Decision-Making
Gantt charts provide valuable insights for decision-making. Project managers can assess the impact of changes, adjust timelines, and allocate resources based on the visual representation of the project.
Stakeholder Engagement
Gantt charts are effective communication tools for engaging stakeholders. They provide a visual representation of the project’s progress and timelines, enabling stakeholders to understand the project’s status and make informed decisions.
Project Documentation
Gantt charts serve as documentation of the project’s planning and execution. They provide a historical record of the project’s timeline, tasks, and milestones, facilitating project review and future reference.
Gantt charts are a powerful and widely used tool in project management due to their ability to visually represent project tasks, timelines, dependencies, and resource allocation. They aid in efficient planning, scheduling, and tracking of projects across various industries and sectors. Whether it’s a construction project, software development, event planning, or any other project, Gantt charts provide a comprehensive view of project progress and enable effective project management. By leveraging the benefits of Gantt charts, project managers can optimize timelines, allocate resources efficiently, and successfully deliver projects on time.


