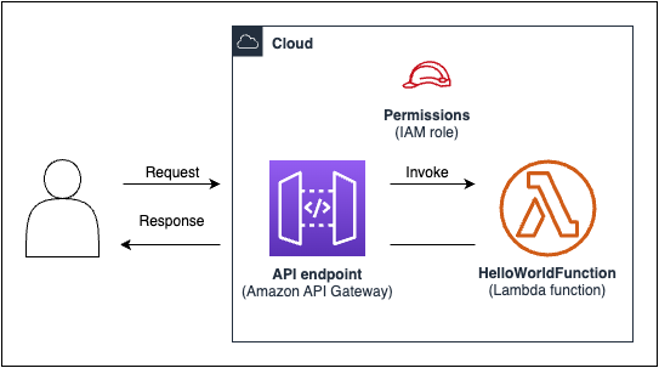
Debugging serverless applications can be challenging due to the distributed and event-driven nature of AWS Lambda functions. AWS Lambda Powertools is a powerful set of utilities and libraries that can simplify the debugging process by providing comprehensive observability and debugging tools. In this blog post, we’ll explore how you can use AWS Lambda Powertools to effectively debug your Lambda functions.
The Challenge of Debugging Serverless Applications
Serverless applications often consist of multiple Lambda functions, each handling different parts of the application’s logic. When issues arise, such as unexpected behavior, errors, or performance bottlenecks, debugging can become complex and time-consuming.
Common challenges in debugging serverless applications include:
- Lack of Visibility: Traditional debugging methods like print statements are less effective in serverless environments, where you have limited access to the underlying infrastructure.
- Distributed Tracing: Understanding the flow of events and data between different Lambda functions can be challenging without a comprehensive tracing solution.
- Identifying Cold Starts: Cold starts can impact the performance of Lambda functions. It’s crucial to identify when and why they occur.
- Resource Utilization: Determining how much CPU, memory, and network resources your functions consume can help optimize their performance and cost.
How to use AWS Lambda Powertools to implement observability best practices
Using AWS Lambda Powertools for Debugging
AWS Lambda Powertools provides a set of features that can greatly simplify the debugging process for your Lambda functions.
1. Logging with Context
Use the built-in logging features of AWS Lambda Powertools to enhance your function’s logs. By including contextual information such as request IDs and AWS request context, you can easily trace the flow of requests through your serverless application. For example:
from aws_lambda_powertools import Logger
logger = Logger()
def lambda_handler(event, context):
logger.info(“Received event”, extra={“event”: event})
# Your Lambda function logic here
2. Tracing with AWS X-Ray
AWS Lambda Powertools integrates seamlessly with AWS X-Ray, which provides distributed tracing capabilities. By using the tracer provided by Powertools, you can capture detailed traces of your Lambda function’s execution and visualize the flow of events across different components of your application.
from aws_lambda_powertools import Tracer
tracer = Tracer()
def lambda_handler(event, context):
# Your Lambda function logic here
3. Metrics Collection
Monitoring and debugging go hand in hand. Use AWS Lambda Powertools to collect custom metrics specific to your Lambda functions. Track metrics like execution time, memory usage, and custom business metrics to identify performance bottlenecks.
from aws_lambda_powertools import Metrics
metrics = Metrics()
def lambda_handler(event, context):
# Your Lambda function logic here
4. Customizing Debugging Settings
AWS Lambda Powertools allows you to customize settings like log levels, sampling rates for tracing, and the default logger name. Adjust these settings to control the amount of debugging information generated and the resources consumed during debugging.
5. Local Testing and Debugging
Use AWS Lambda Powertools in conjunction with local testing frameworks and tools to simulate Lambda function invocations on your development machine. This enables you to test and debug your code locally before deploying it to AWS.
Debugging AWS Lambda functions in serverless applications can be a challenging task due to their distributed and event-driven nature. AWS Lambda Powertools simplifies this process by providing tools and utilities that enhance observability, tracing, and logging capabilities.
By incorporating AWS Lambda Powertools into your serverless development workflow, you can streamline the debugging process, identify issues more effectively, and optimize the performance and reliability of your Lambda functions. Debugging in the serverless world doesn’t have to be daunting when you have the right tools at your disposal.

