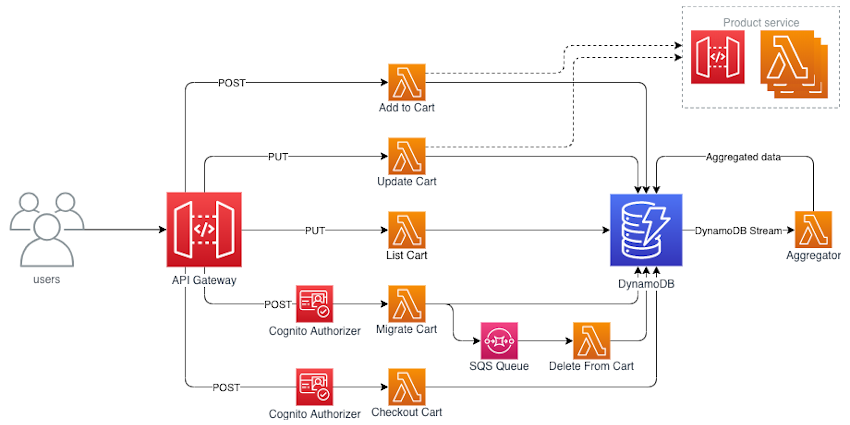
AWS Lambda Powertools is a set of open-source utilities and best practices designed to simplify the implementation of observability in serverless applications. In this blog post, we will explore how to use AWS Lambda Powertools to implement observability best practices in your AWS Lambda functions.
What is Observability?
Observability is the ability to understand the internal state and behavior of a system based on its external outputs. In the context of AWS Lambda functions, observability encompasses the collection, analysis, and visualization of data related to function execution, including logs, metrics, and traces.
Observability best practices typically include the following components:
- Logging: Capturing relevant information about the Lambda function’s execution, such as input data, output data, and any errors or exceptions that occur.
- Metrics: Collecting and aggregating performance data, such as execution time, memory usage, and invocation counts.
- Tracing: Creating a detailed trace of the function’s execution path, allowing you to understand how different components of your application interact.
- Alerting: Setting up alerts based on specific metrics or events to proactively identify and address issues.
Why Use AWS Lambda Powertools?
AWS Lambda Powertools is a collection of utilities, libraries, and patterns that simplify the implementation of observability best practices in your Lambda functions. Here are some of the key benefits of using AWS Lambda Powertools:
- Simplified Instrumentation: Powertools provides a set of easy-to-use APIs for instrumenting your Lambda functions, making it straightforward to add logging, metrics, and tracing.
- Consistency: It enforces consistent naming conventions for logs, metrics, and traces, which makes it easier to correlate data across different components of your serverless application.
- Integration with AWS Services: Powertools integrates seamlessly with AWS services like AWS X-Ray for tracing and AWS CloudWatch for metrics and logging.
- Customizable: While Powertools offers default settings and configurations, it allows you to customize and extend its functionality to meet the specific needs of your application.
Choosing the Right Framework for Migrating Java EE Applications to Microservices
Getting Started with AWS Lambda Powertools
To implement observability best practices using AWS Lambda Powertools, follow these steps:
Step 1: Installation
Start by adding the AWS Lambda Powertools libraries to your Lambda function’s deployment package. You can include the necessary libraries in your requirements.txt file for Python functions or in your deployment package for other runtimes.
Step 2: Instrument Your Code
Use the provided APIs to instrument your Lambda function code. For example, you can use the tracer.capture_lambda_handler decorator to trace your Lambda function’s execution. Similarly, you can use logger and metrics functions to add logging and metrics to your code.
from aws_lambda_powertools import Logger, Metrics, Tracer
logger = Logger()
metrics = Metrics()
tracer = Tracer()
def lambda_handler(event, context):
logger.info(“Processing event”, extra={“event”: event})
metrics.add_metric(name=“ProcessingTime”, unit=“Milliseconds”, value=42)
# Your Lambda function logic here
Step 3: Configuration
AWS Lambda Powertools allows you to configure various settings, such as the sampling rate for tracing, the log level, and the default logger name. You can customize these settings to suit your application’s requirements.
Step 4: Deployment and Testing
Deploy your Lambda function with the AWS Lambda Powertools libraries included in the deployment package. Test your function to ensure that observability data is being collected correctly.
Step 5: Monitoring and Alerts
Set up monitoring and alerts in AWS CloudWatch based on the metrics and logs generated by your Lambda function. You can create CloudWatch Alarms to notify you of any abnormal behavior.
From Repositories to CI/CD: GitHub vs. GitLab Breakdown
GitHub and Bitbucket: A Side-by-Side Analysis for Optimal Version Contro
DevOps and SRE: Two Methodologies, One Goal – A Comparative Study
WildFly vs. Tomcat: Choosing the Right Java Application Server
OpenCL vs. OpenGL: Understanding the Difference
Observability is crucial for maintaining the reliability and performance of serverless applications running on AWS Lambda. AWS Lambda Powertools simplifies the implementation of observability best practices by providing a set of libraries and utilities that make it easy to add logging, metrics, tracing, and alerting to your Lambda functions.
By following the steps outlined in this blog post, you can enhance the observability of your serverless applications and gain valuable insights into their behavior and performance. AWS Lambda Powertools empowers developers to focus on building great applications while ensuring they are well-instrumented for monitoring and troubleshooting.

