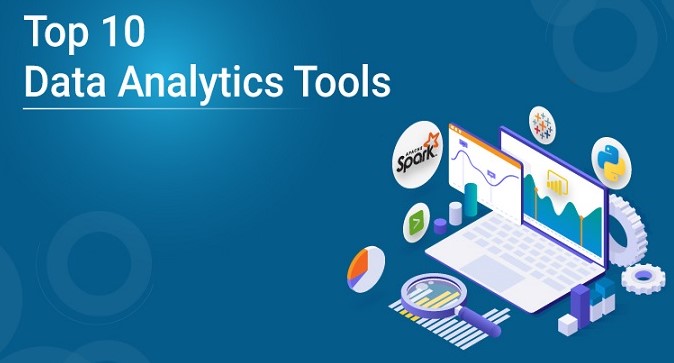
10 Essential Data Analytics Tools for Effective Data Analysis
Data analytics has become a critical component in decision-making processes across industries. To extract valuable insights from vast amounts of data, professionals rely on specialized data analytics tools. These tools provide functionalities for data manipulation, visualization, statistical analysis, and machine learning. In this blog post, we will explore ten powerful data analytics tools that can help you streamline your data analysis workflows and uncover actionable insights.
Tableau
Tableau is a leading data visualization tool that allows users to create interactive dashboards and visualizations. Its intuitive interface and drag-and-drop functionality make it easy to explore and present data visually. Tableau supports a wide range of data sources and provides robust analytics capabilities for in-depth exploration and storytelling.
Python
Python is a versatile programming language widely used in data analysis. With libraries like Pandas, NumPy, and Matplotlib, Python offers extensive data manipulation, analysis, and visualization capabilities. Its flexibility and vast ecosystem make it a popular choice for data analysts and data scientists.
R
R is a statistical programming language designed for data analysis and visualization. It offers a wide range of statistical and graphical techniques, making it suitable for advanced data analytics tasks. R’s extensive package repository, including packages like dplyr and ggplot2, enables efficient data manipulation and visualization.
SQL
Structured Query Language (SQL) is a fundamental tool for working with relational databases. It allows analysts to query, manipulate, and manage large datasets efficiently. SQL’s syntax is optimized for database operations, making it indispensable for data retrieval, aggregation, and transformation.
Microsoft Excel
Excel is a ubiquitous tool used for data analysis, especially for small to medium-sized datasets. It offers essential data manipulation functionalities, built-in statistical functions, and charting capabilities. Excel’s familiarity and ease of use make it a go-to tool for quick analyses and basic visualizations.
10 Online Certifications to Become a Successful Data Analyst
Power BI
Power BI, a business intelligence tool by Microsoft, enables users to visualize and share data insights across organizations. It connects to various data sources, provides interactive visualizations, and allows for data exploration and collaboration. Power BI is known for its user-friendly interface and seamless integration with other Microsoft products.
SAS
SAS (Statistical Analysis System) is a comprehensive analytics platform with a wide range of tools for data management, analytics, and predictive modeling. SAS offers a robust programming language, advanced statistical procedures, and industry-specific solutions for sectors like healthcare, finance, and marketing.
Apache Spark
Apache Spark is an open-source big data processing framework that provides distributed computing capabilities. It enables high-speed data processing and analytics on large datasets across clusters of computers. Spark’s ability to handle complex computations and its integration with other data analytics libraries make it a powerful tool for big data analytics.
KNIME
KNIME (Konstanz Information Miner) is an open-source data analytics platform that offers a visual workflow interface. It allows users to create, combine, and execute data analysis workflows using a wide range of built-in tools and integrations. KNIME is known for its flexibility and extensibility, making it suitable for both beginners and advanced users.
QlikView
QlikView is a data discovery and visualization tool that provides interactive and associative data analysis capabilities. It enables users to explore data from multiple sources, create interactive dashboards, and perform ad-hoc analyses. QlikView’s associative model allows for dynamic data exploration and uncovering hidden relationships.
Data analytics tools empower professionals to transform raw data into actionable insights. The ten tools mentioned above, including Tableau, Python, R, SQL, Excel, Power BI, SAS, Apache Spark, KNIME, and QlikView, offer a range of functionalities to suit different data analysis requirements. Whether you need advanced visualization, statistical analysis, data manipulation, or big data processing, these tools can help you unlock the full potential of your data and make informed decisions in your organization. Explore these tools, assess your specific needs, and choose the ones that best align with your data analytics goals.

